Trade
Basic
Futures
Futures
Hundreds of contracts settled in USDT or BTC
TradFi
Gold
Trade global traditional assets with USDT in one place
Options
Hot
Trade European-style vanilla options
Unified Account
Maximize your capital efficiency
Demo Trading
Futures Kickoff
Get prepared for your futures trading
Futures Events
Participate in events to win generous rewards
Demo Trading
Use virtual funds to experience risk-free trading
Earn
Launch
CandyDrop
Collect candies to earn airdrops
Launchpool
Quick staking, earn potential new tokens
HODLer Airdrop
Hold GT and get massive airdrops for free
Launchpad
Be early to the next big token project
Alpha Points
New
Trade on-chain assets and enjoy airdrop rewards!
Futures Points
New
Earn futures points and claim airdrop rewards
Investment
Simple Earn
Earn interests with idle tokens
Auto-Invest
Auto-invest on a regular basis
Dual Investment
Buy low and sell high to take profits from price fluctuations
Soft Staking
Earn rewards with flexible staking
Crypto Loan
0 Fees
Pledge one crypto to borrow another
Lending Center
One-stop lending hub
VIP Wealth Hub
Customized wealth management empowers your assets growth
Private Wealth Management
Customized asset management to grow your digital assets
Quant Fund
Top asset management team helps you profit without hassle
Staking
Stake cryptos to earn in PoS products
Smart Leverage
New
No forced liquidation before maturity, worry-free leveraged gains
GUSD Minting
Use USDT/USDC to mint GUSD for treasury-level yields
More
CryptoCowboy
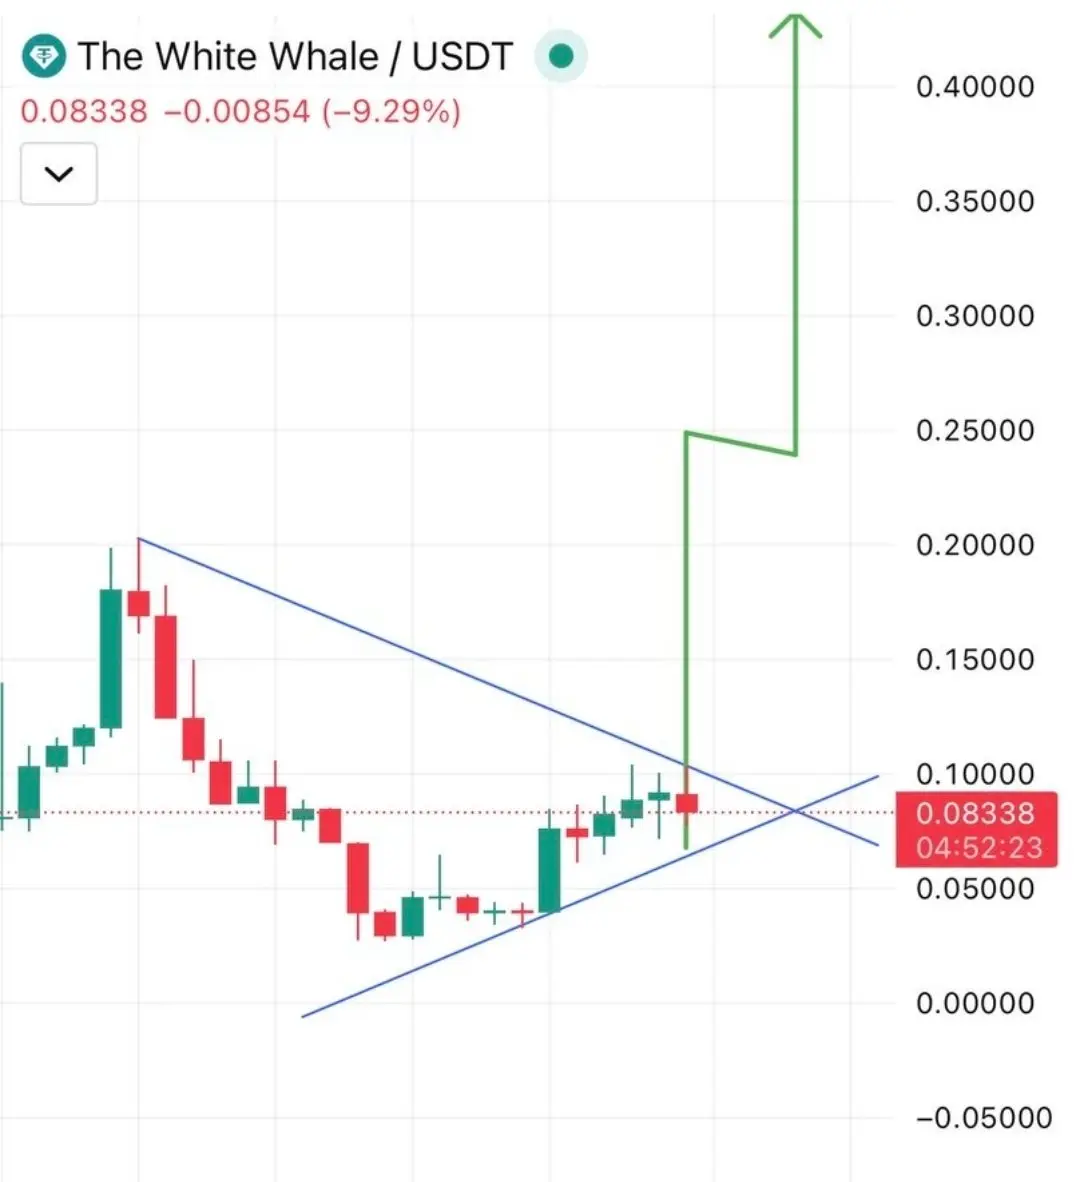
#WHITEWHALE added your portfolio from here 🚀🚀🚀Believe it will pump more gem from here. Adding more here 💰
- Reward
- 1
- Comment
- Repost
- Share
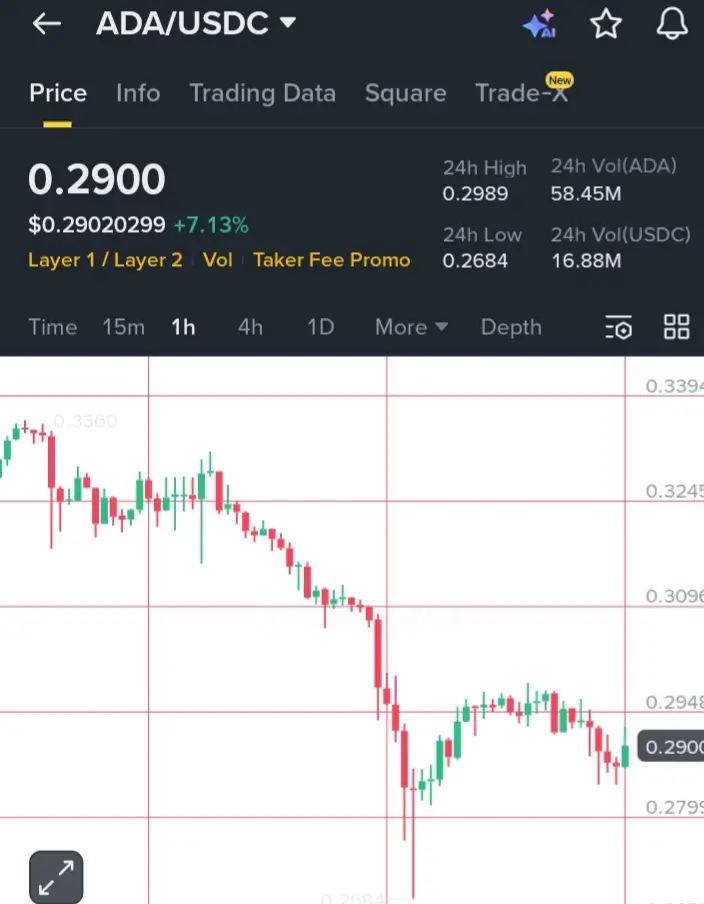
$ADA is showing fresh bullish momentum after reclaiming key support, with buyers pushing price back toward short-term resistance as volume improves.
Higher lows on lower timeframes suggest accumulation, and a breakout above nearby levels could open room for continuation, keeping traders focused on upside opportunities while managing risk carefully.
#Trading #Gate
Higher lows on lower timeframes suggest accumulation, and a breakout above nearby levels could open room for continuation, keeping traders focused on upside opportunities while managing risk carefully.
#Trading #Gate
ADA0,7%
- Reward
- 2
- Comment
- Repost
- Share
BAHLIL
$BAHLIL
Created By@GateUser-9998fb48
Listing Progress
0.00%
MC:
$2.8K
Create My Token
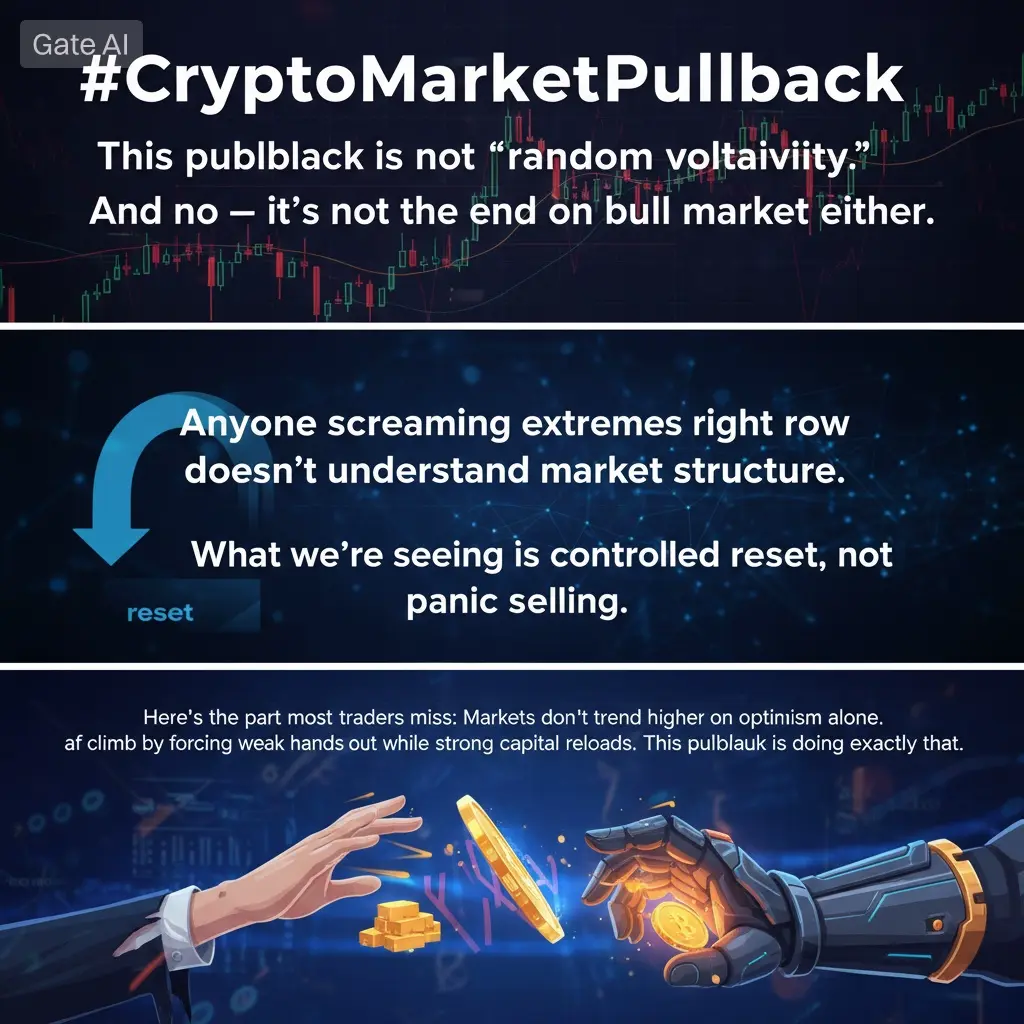
#CryptoMarketPullback #CryptoMarketPullback
This pullback is not “random volatility.”
And no — it’s not the end of the bull market either.
Anyone screaming extremes right now doesn’t understand market structure.
What we’re seeing is a controlled reset, not panic selling.
Here’s the part most traders miss:
Markets don’t trend higher on optimism alone. They climb by forcing weak hands out while strong capital reloads. This pullback is doing exactly that.
Zoom out. Liquidity was heavily concentrated above recent highs. Funding rates were stretched. Leverage was complacent. When price moves too cl
- Reward
- 2
- 2
- Repost
- Share
HighAmbition :
:
1000x VIbes 🤑View More
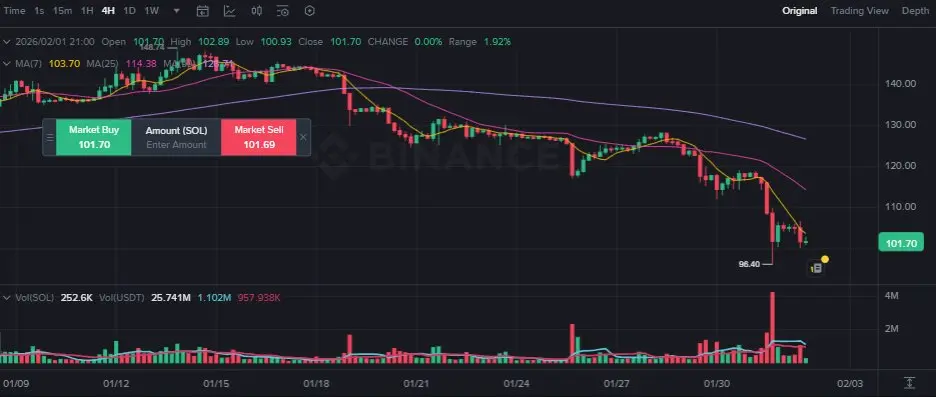
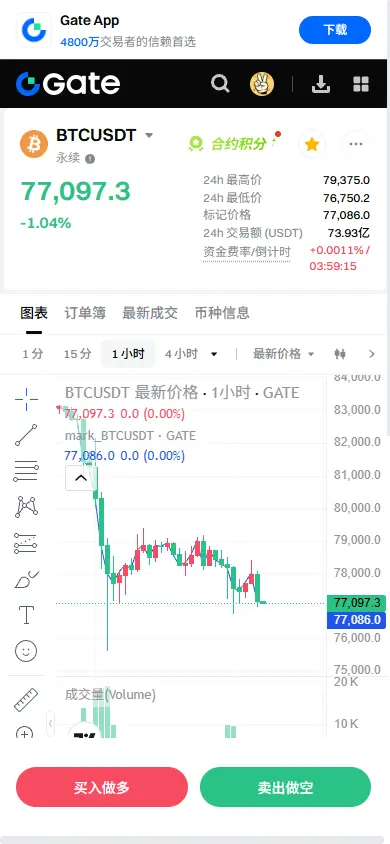
Bitcoin market today does not crash loudly; it weakens gradually, as if giving market participants time to reconsider their positions. This slow decline allows traders to observe and prepare for what might come next, rather than sudden panic selling.
After briefly touching the 79,300 level, Bitcoin failed to maintain its upward momentum. Sellers began to take control, pushing the price down to around 77,000. This was not driven by panic, but rather a well-organized distribution phase— a type of pressure that often appears when the market feels the price has moved too far, too fast.
Currently,
View OriginalAfter briefly touching the 79,300 level, Bitcoin failed to maintain its upward momentum. Sellers began to take control, pushing the price down to around 77,000. This was not driven by panic, but rather a well-organized distribution phase— a type of pressure that often appears when the market feels the price has moved too far, too fast.
Currently,

- Reward
- 2
- Comment
- Repost
- Share
BITCOIN analysis
0
- Reward
- like
- Comment
- Repost
- Share
A new week, BTC will continue to decline and test the bottom! 1) Weekly chart, if nothing unexpected, shows an almost barefoot long bearish candlestick, with two consecutive weeks of bearish candles, indicating C wave decline is in progress; 2) Daily chart, four consecutive days of bearish K-lines, with downward shift in focus, and the downward trend still continuing; 3) Four-hour chart, again on Friday, a bearish main volume appeared, approaching two-thirds of the 1011 bearish main volume; 4) Order book, buy order funds are decreasing, and after breaking below 80,000, the bulls are no longer
BTC-0,65%
- Reward
- like
- Comment
- Repost
- Share
- Reward
- 1
- Comment
- Repost
- Share
I am securely trading cryptocurrencies on the 12-year-old established exchange Gate.com. Join me now in participating in the hottest activity! https://www.gate.com/campaigns/3969?ref=VQVDAASLBQ&ref_type=132&utm_cmp=SlwTM2Wp
View Original
- Reward
- like
- Comment
- Repost
- Share
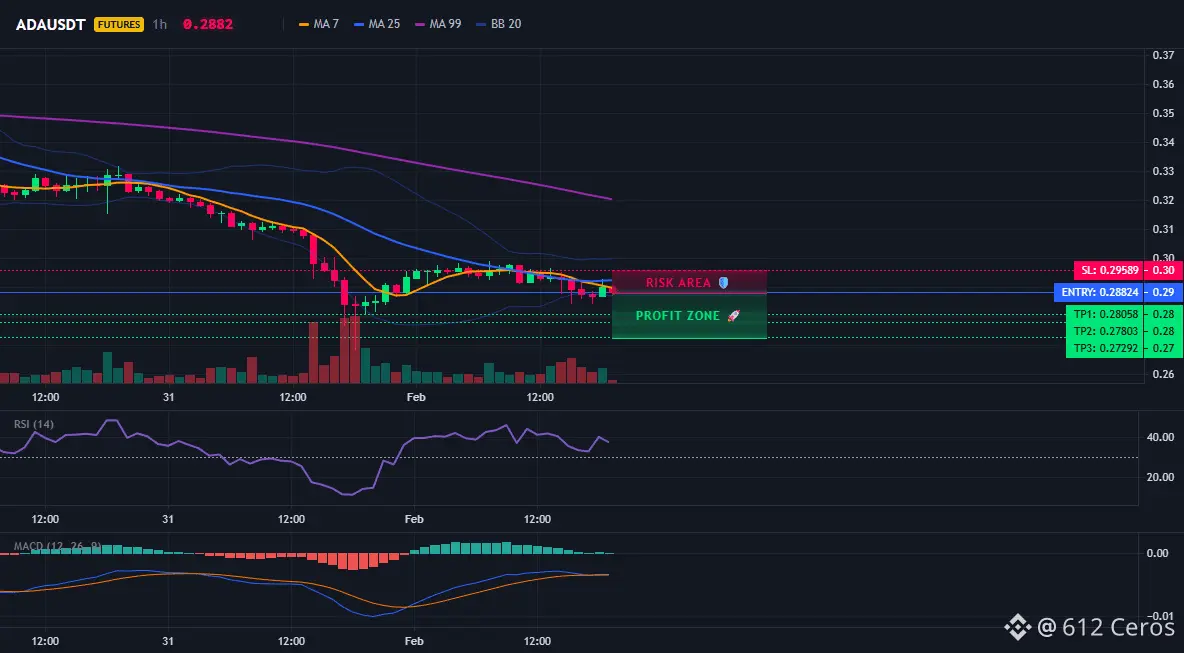
$ADA /USDT - SHORT
Trade Plan:
Entry: 0.28696 – 0.289512
SL: 0.295893
TP1: 0.280579
TP2: 0.278026
TP3: 0.272921
Why this setup?
SHORT signal armed with 75% confidence. Daily trend is bearish, and price is testing a key 1h reference level at 0.2882 for a potential rejection. RSI on lower timeframes shows no bullish strength.
Debate:
Is this the final shakeout before ADA drops to TP1 at 0.2806?$ADA
ADA0,7%
- Reward
- like
- Comment
- Repost
- Share
the only thing that could save crypto

- Reward
- like
- Comment
- Repost
- Share
#Non-StopEarningsThisLunarNewYear 🧧✨
As the Lunar New Year arrives, it brings more than just celebrations, traditions, and new beginnings it also opens the door to fresh opportunities for growth, prosperity, and non-stop earnings. This festive season symbolizes renewal, luck, and ambition, making it the perfect time to focus on smarter financial moves and consistent income streams.
In today’s digital-first world, earning is no longer limited to traditional 9-to-5 jobs. The Lunar New Year reminds us to think strategically, adapt to change, and embrace opportunities that allow income to flow co

- Reward
- 1
- Comment
- Repost
- Share
chn
chojny
Created By@GateUser-3bbb703e
Subscription Progress
0.00%
MC:
$0
Create My Token
I hope this guy is still with us
- Reward
- like
- Comment
- Repost
- Share
【$BTC Signal】Empty Position + Volume-Price Divergence Observation
$BTC Price decline accompanied by high trading volume, requiring combined analysis of open interest changes to determine whether it is a healthy correction or a trend reversal. The current market indicates weakening bullish momentum, but no structural breakdown has occurred.
🎯 Direction: Empty Position
Waiting for a clear signal: if open interest decreases simultaneously, it indicates a healthy reset caused by long liquidation; if open interest increases while the price declines, caution is needed for potential main force dis
View Original$BTC Price decline accompanied by high trading volume, requiring combined analysis of open interest changes to determine whether it is a healthy correction or a trend reversal. The current market indicates weakening bullish momentum, but no structural breakdown has occurred.
🎯 Direction: Empty Position
Waiting for a clear signal: if open interest decreases simultaneously, it indicates a healthy reset caused by long liquidation; if open interest increases while the price declines, caution is needed for potential main force dis
- Reward
- like
- Comment
- Repost
- Share
Unfollowed 100 more accounts today. Slowly fixing my timeline.

- Reward
- like
- Comment
- Repost
- Share
A massive lucky draw carnival is here with fully upgraded rewards. This round introduces GAIX, DN, and CYS rewards. All prizes are credited automatically and instantly upon winning. Every day, one user will win GAIX worth 150 USDT, along with generous cash rewards waiting to be claimed. Let’s celebrate and enjoy this exciting winter together. https://www.gate.com/ar/campaigns/3928?ch=765&ref=VQRNAFWMBG&ref_type=132&utm_cmp=7rFMZCXC

- Reward
- 1
- 3
- Repost
- Share
GateUser-4545e1f7:
Buy to achieve gains 💎View More
Why ARB and OP are Must-Haves
1
- Reward
- like
- Comment
- Repost
- Share
Check out Gate and join me in the hottest event! https://www.gate.com/ru/campaigns/3913?ref=VVBAUQSMVA&ref_type=132&utm_cmp=ApbojVO9

- Reward
- 1
- Comment
- Repost
- Share
#GateLiveMiningProgramPublicBeta Most traders will scroll past this and miss it. That’s fine. Markets reward attention, not noise.
Gate didn’t launch the Live Mining Program (Public Beta) for entertainment. This is a structural shift in how attention, liquidity, and participation are monetized inside an exchange ecosystem. If you think this is “just another activity,” that’s a lazy take—and laziness gets liquidated.
Here’s the hard truth:
Exchanges no longer reward passive users. Holding tokens and waiting is dead capital. Gate is clearly testing a model where engagement = yield. Live interact

- Reward
- 3
- 3
- Repost
- Share
HighAmbition:
Buy To Earn 💎View More
Who has a wallet?I want to do something special to it😉

- Reward
- 1
- 2
- Repost
- Share
GateUser-38e516db:
Really?View More
Load More
Join 40M users in our growing community
⚡️ Join 40M users in the crypto craze discussion
💬 Engage with your favorite top creators
👍 See what interests you
Trending Topics
View More37.67K Popularity
71.9K Popularity
370.52K Popularity
50.11K Popularity
69.27K Popularity
News
View MoreETH drops below 2300 USDT
6 m
Data: In the past 24 hours, the entire network has been liquidated for $362 million, with long positions liquidated for $228 million and short positions liquidated for $134 million.
34 m
BTC drops below 77,000 USDT
38 m
Data: If BTC breaks through $81,986, the total liquidation strength of mainstream CEX short positions will reach $1.318 billion.
2 h
ETH Breaks Through 2350 USDT
2 h
Pin